
Where

.png)
.png)
.png)
meets data.
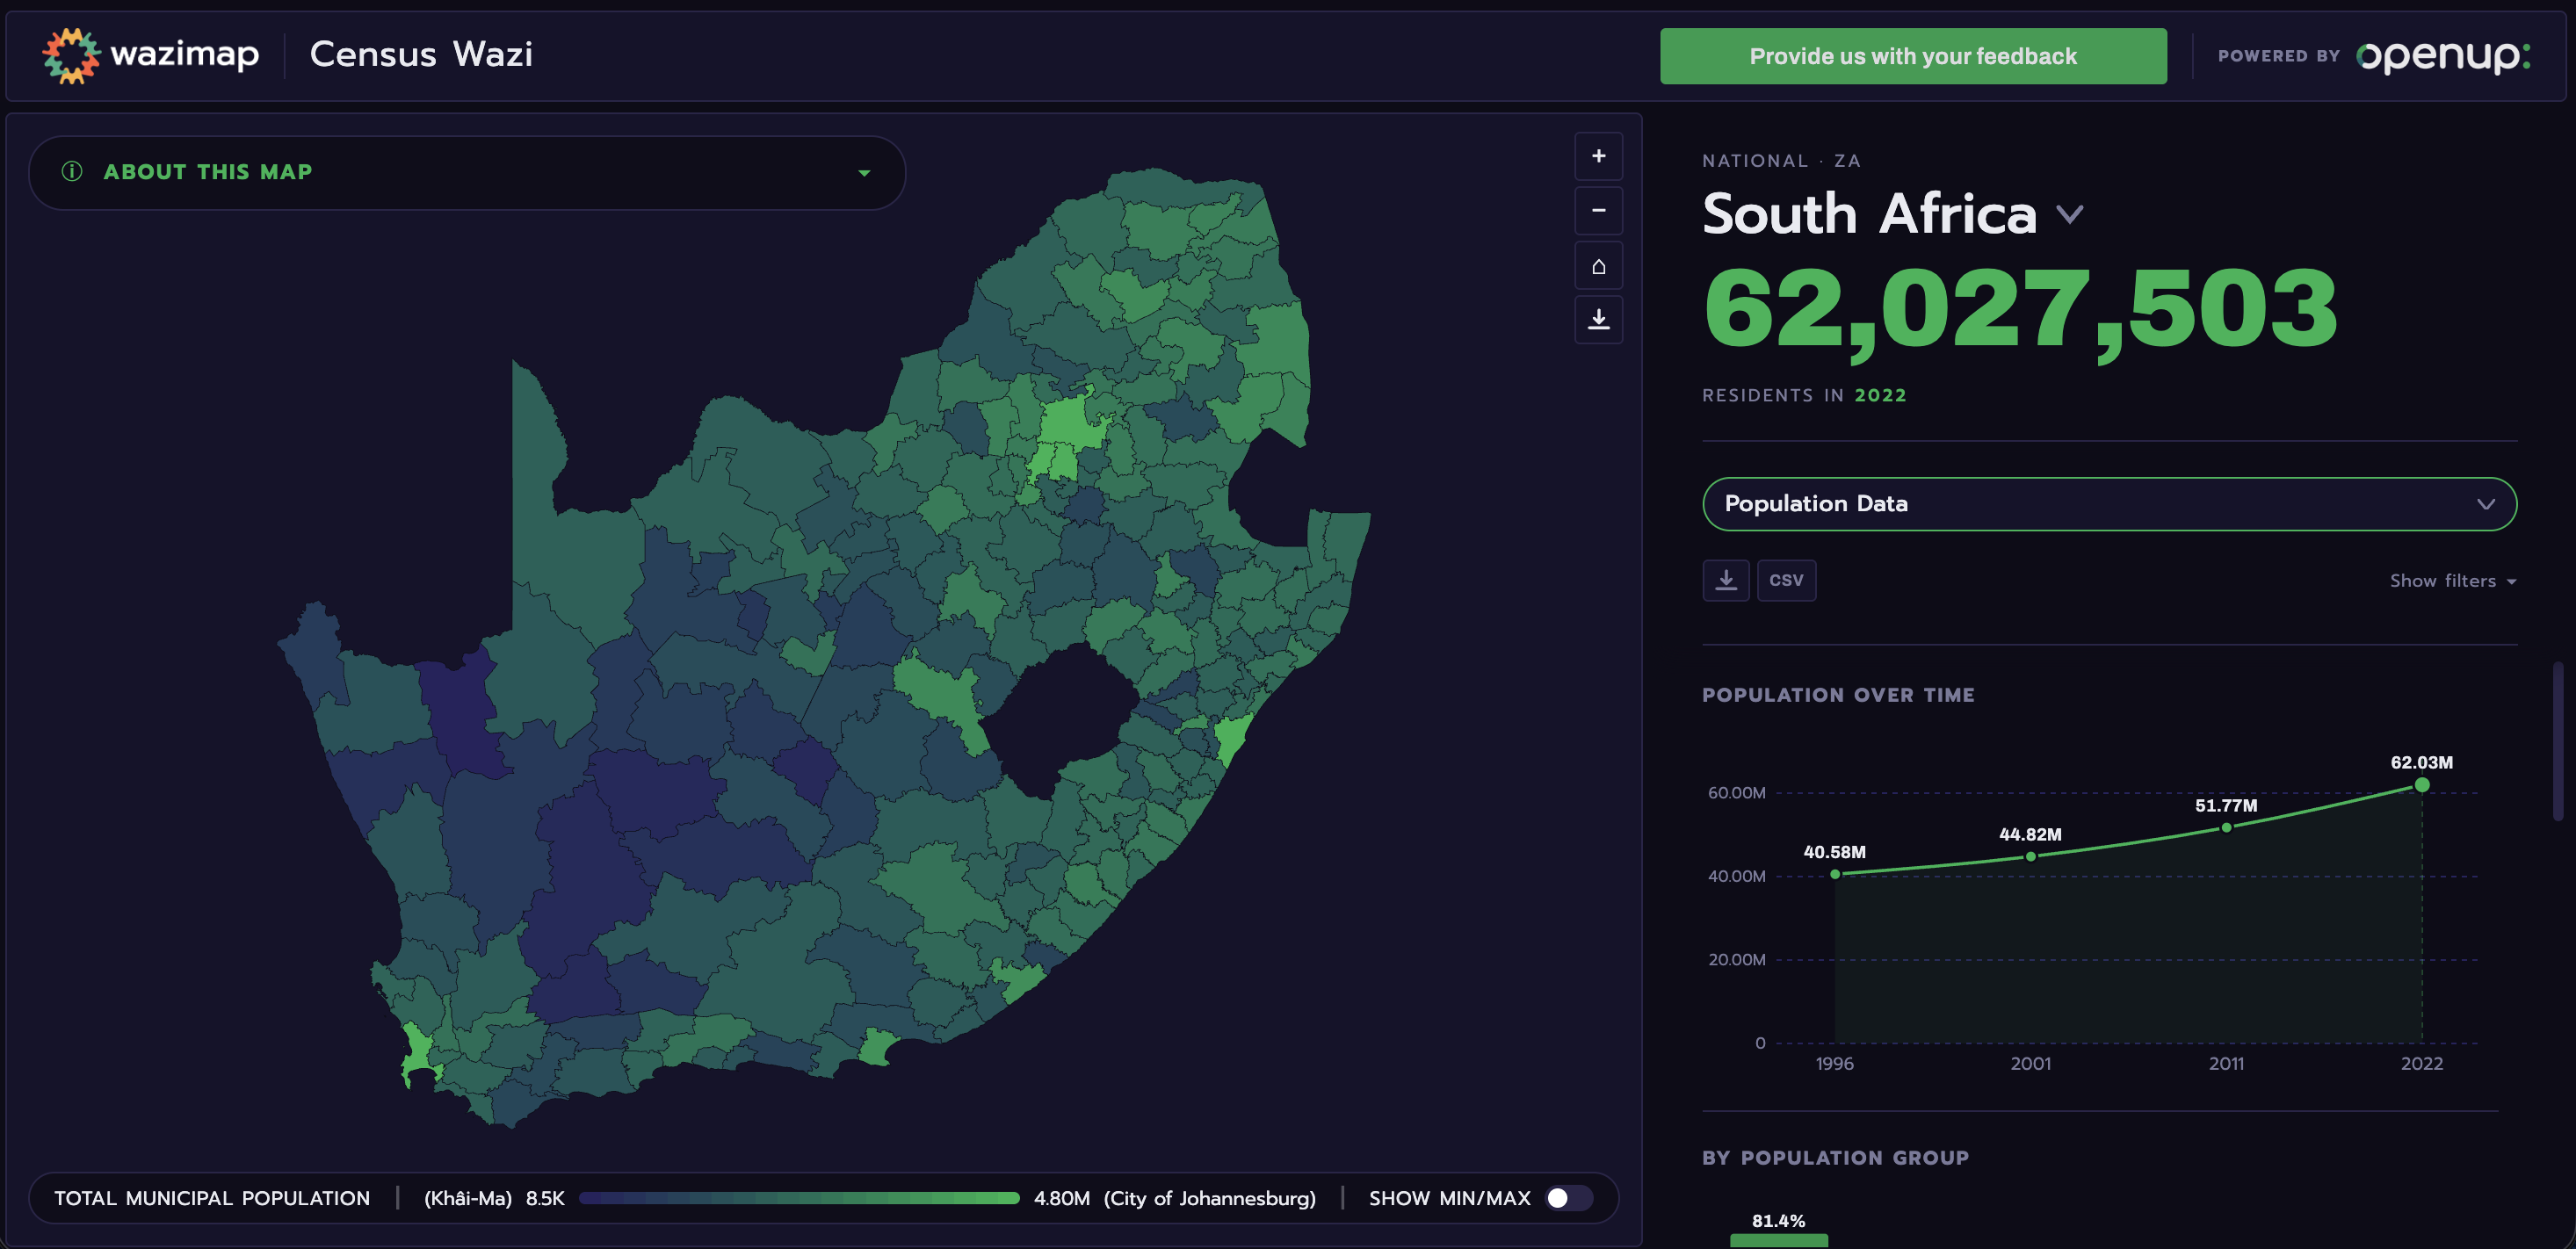
The fast, user-friendly data dashboard
Wazimap is a comprehensive GIS and data analysis tool used by local governments, civil society organisations and corporate social responsibility programmes to help them…
.jpg)


Inform and engage
Explore relationships between geography, population and resources
Wazimap is the map-based data dashboard that provides the richest and easiest to use interface for encouraging community participation in local issues. It tells the story of an area by merging datasets together to provide context within a click.

Step-by-step support
Prepare, publish and promote your data
With over 10 years experience curating data for engagement and usability, OpenUp will work with you to ensure that your Wazimap profile achieves the highest impact possible for your organisation or users.
Plan and collaborate
Communicate needs and plan effectively with colleagues and stakeholders
Wazimap is the map-based explorer that supports real understanding of local conditions. It makes resource planning and decision making easy.


How our partners use Wazimap
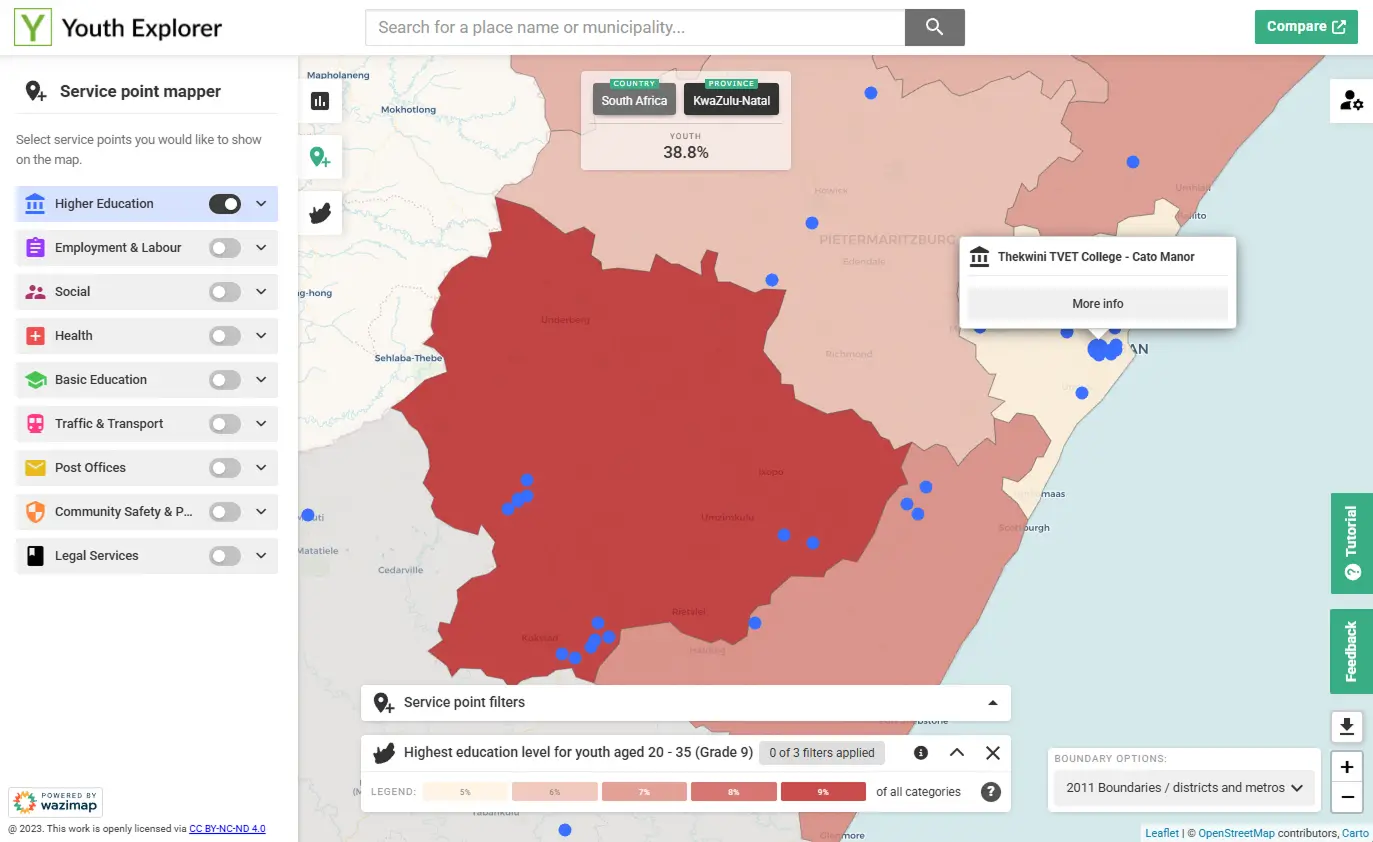
Youth Explorer
Putting youth data at the centre of decision-making
Youth Explorer focuses on the lived realities of young people in South Africa. It brings together data on education, employment, health, and wellbeing to highlight both the challenges and opportunities facing youth across different regions.By making youth-specific data accessible and visual, the platform supports policymakers, civil society, and researchers in designing interventions that respond to real needs and in tracking progress over time.
Community Explorer
A community-level view of South Africa
Community Explorer provides a detailed, place-based snapshot of life across South African communities. It combines demographic, economic, and service delivery data to help users understand how conditions differ from one area to another.Whether used for research, advocacy, planning, or storytelling, Community Explorer helps surface local realities that are often hidden in national statistics empowering better decisions at a community level.
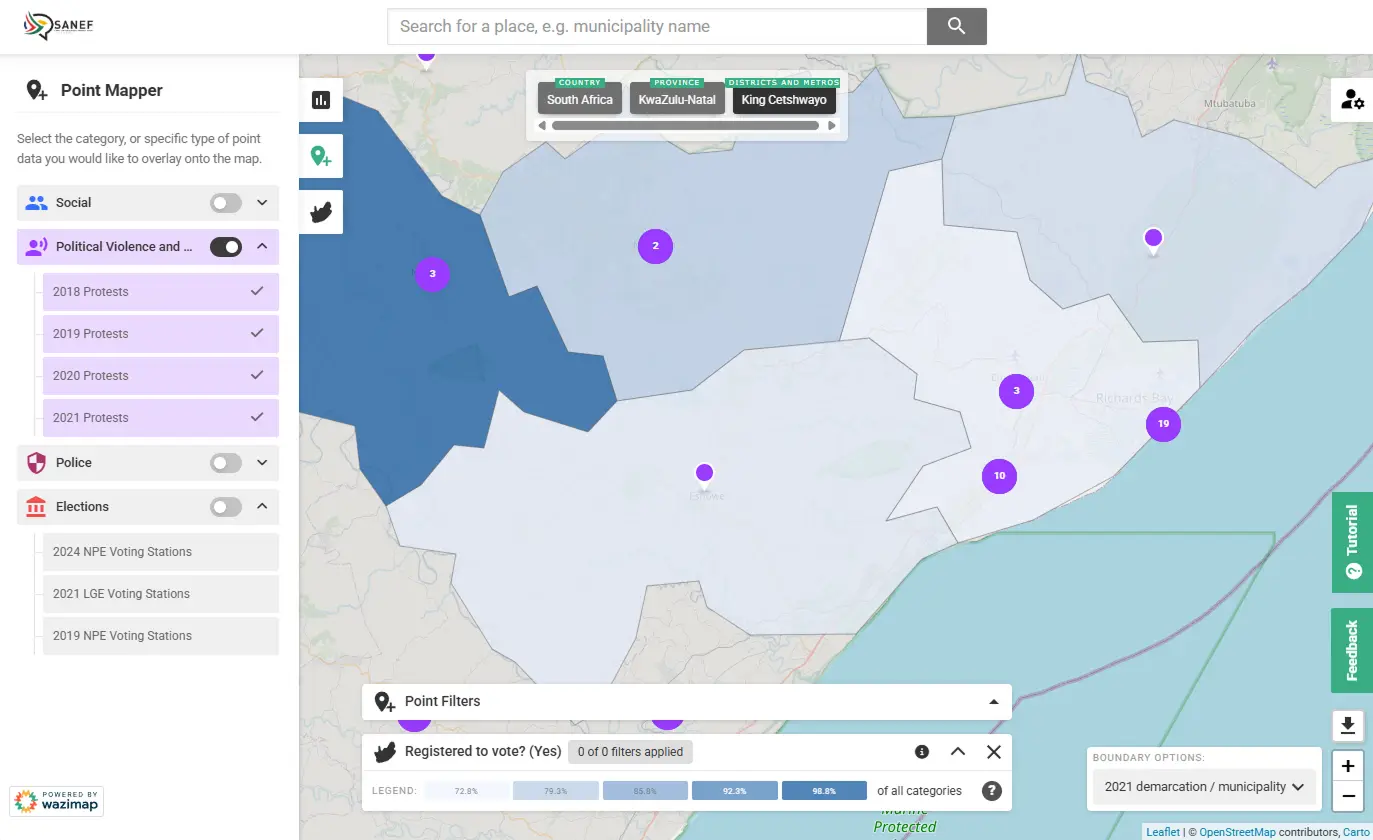
SANEF (South African National Editors’ Forum)
Elections, explained with data
The SANEF Election Dashboard was created to support accurate, data-driven election reporting in South Africa. It combines electoral results, voter turnout, and demographic context into a single, easy-to-navigate platform. Designed for journalists and the public alike, the dashboard helps users move beyond headline numbers to understand what election outcomes mean for communities, regions, and the country as a whole strengthening transparency, accountability, and public trust in democratic processes.
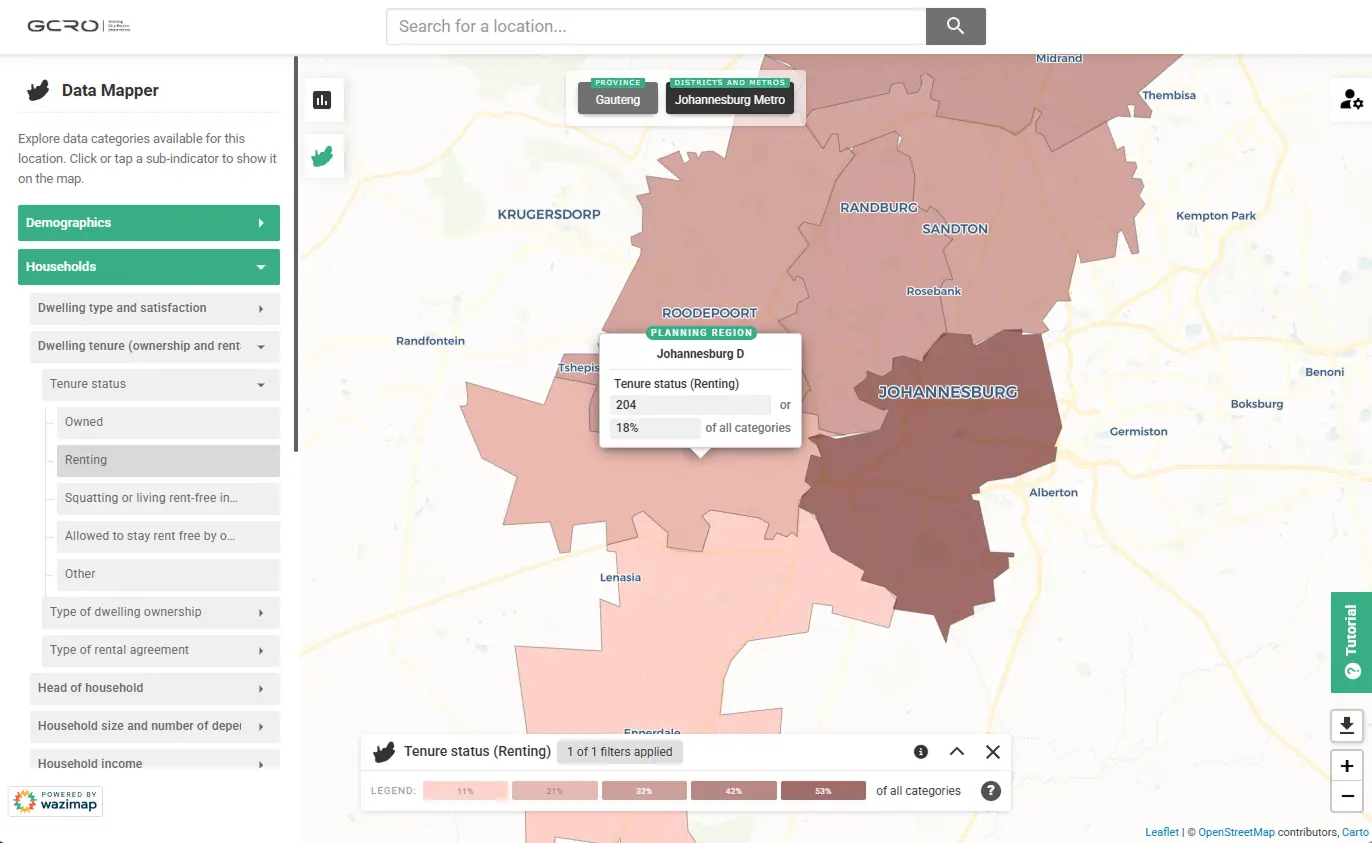
GCRO (Gauteng City-Region Observatory)
Understanding the Gauteng City-Region through data
The GCRO Data Portal makes complex socio-economic data about the Gauteng City-Region accessible and easy to explore. Built to support evidence-based research and planning, it brings together official datasets on population, migration, employment, housing, and wellbeing. By visualising this data spatially, the portal helps researchers, policymakers, and planners identify trends, compare regions, and better understand how people experience life across Gauteng from neighbourhood level insights to province-wide patterns.
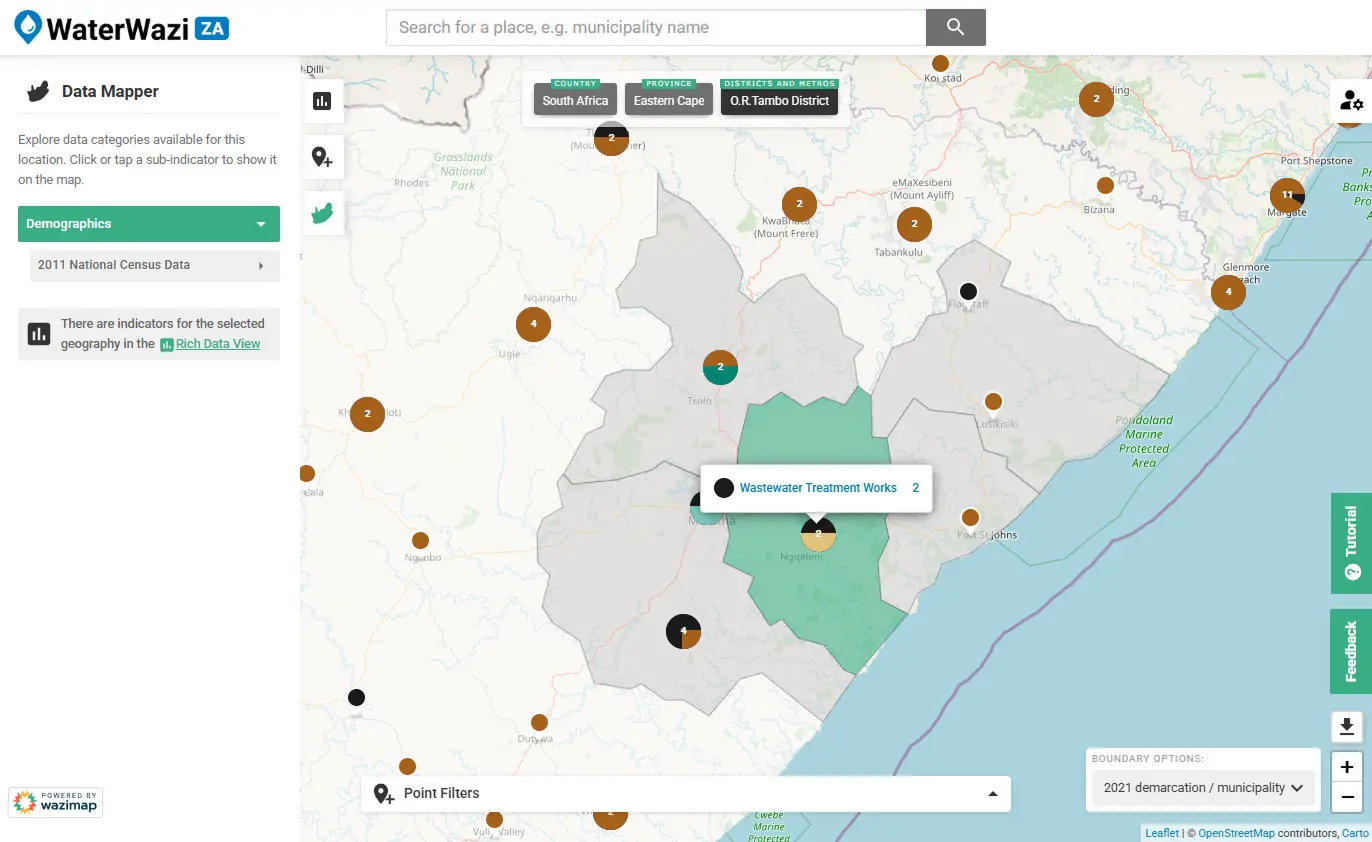
Water Wazi
Tracking water access and service delivery
Water Wazi shines a light on water access, infrastructure, and service delivery across South Africa. By bringing together data from multiple public sources, it helps users explore where water systems are working and where communities are at risk.The platform supports journalists, activists, and policymakers in monitoring service delivery challenges, responding to water crises, and advocating for equitable access to this essential resource.
Frequently asked questions
What is Wazimap?
Wazimap is an open-source, web-based geographic information system (GIS) that helps users explore, analyse, and understand socio-economic and service delivery data through maps and data visualisations.
Is Wazimap free to use?
Yes. The core Wazimap platform is free and publicly accessible. Anyone can explore available datasets through the flagship Wazimap instance and selected partner projects.
What is the difference between Wazimap and partner instances?
The flagship Wazimap is the core product that showcases how Wazimap works using curated datasets. Partner instances are customised versions built by organisations using Wazimap to focus on specific themes or audiences (e.g. elections, youth, water, communities).
Is this the same as the old Wazimap?
No. This is the newer version of Wazimap with an updated architecture, improved performance, and expanded capabilities. While it may look different, it is actively maintained and continues to evolve.
Do I need to request a demo to use Wazimap?
No. You can start using Wazimap immediately by clicking “Explore Wazimap” on the homepage. To view our partner instances you can click the “Partner Wazimap” on the homepage as well. Demos are intended for organisations interested in building their own instance or subscribing to additional services.
Who is Wazimap for?
Wazimap is used by journalists and media organisations, government departments and public agencies, NGOs and civil society organisations, researchers, analysts and students, or anyone interested in understanding communities through data can use Wazimap.
Getting your own Wazimap is easy
We help clean and curate your data
High quality, organised data is the foundation of great data presentation. We have years of experience sourcing, cleaning, curating and maintaining data. Let us help you get started!
Choose contextual data from our collections
Relying on highly focused datasets can only take your dashboard so far. Use our large library of supporting datasets and point data collections to create powerful narratives.
Draw on our expertise for support and training
Need assistance with your dashboard? Our team is available to assist with any level of technical support. From setup and onboarding to curation and maintenance.
Organisations using Wazimap
Click to see how they are using Wazimap

Request a demo
Enter your email address below and a member of our team will contact you to schedule a demo.
.jpg)